
2020.11.29
That's one thing about life: it's easy to forget how much of it many of us our blessed with. Days rush by, weeks drags, and years can fly past - but there's a lot in there if you pay attention. That's good news if you're living a life (as long as you're having a reasonable time of it!) but bad news if you're trying to make an information-rich detailed graphical representation of it.
In making my main timeline, full of photos of places and people that I've loved, I experimented with different visual displays. This weekend I put together one more form: the rainbow-like arch:
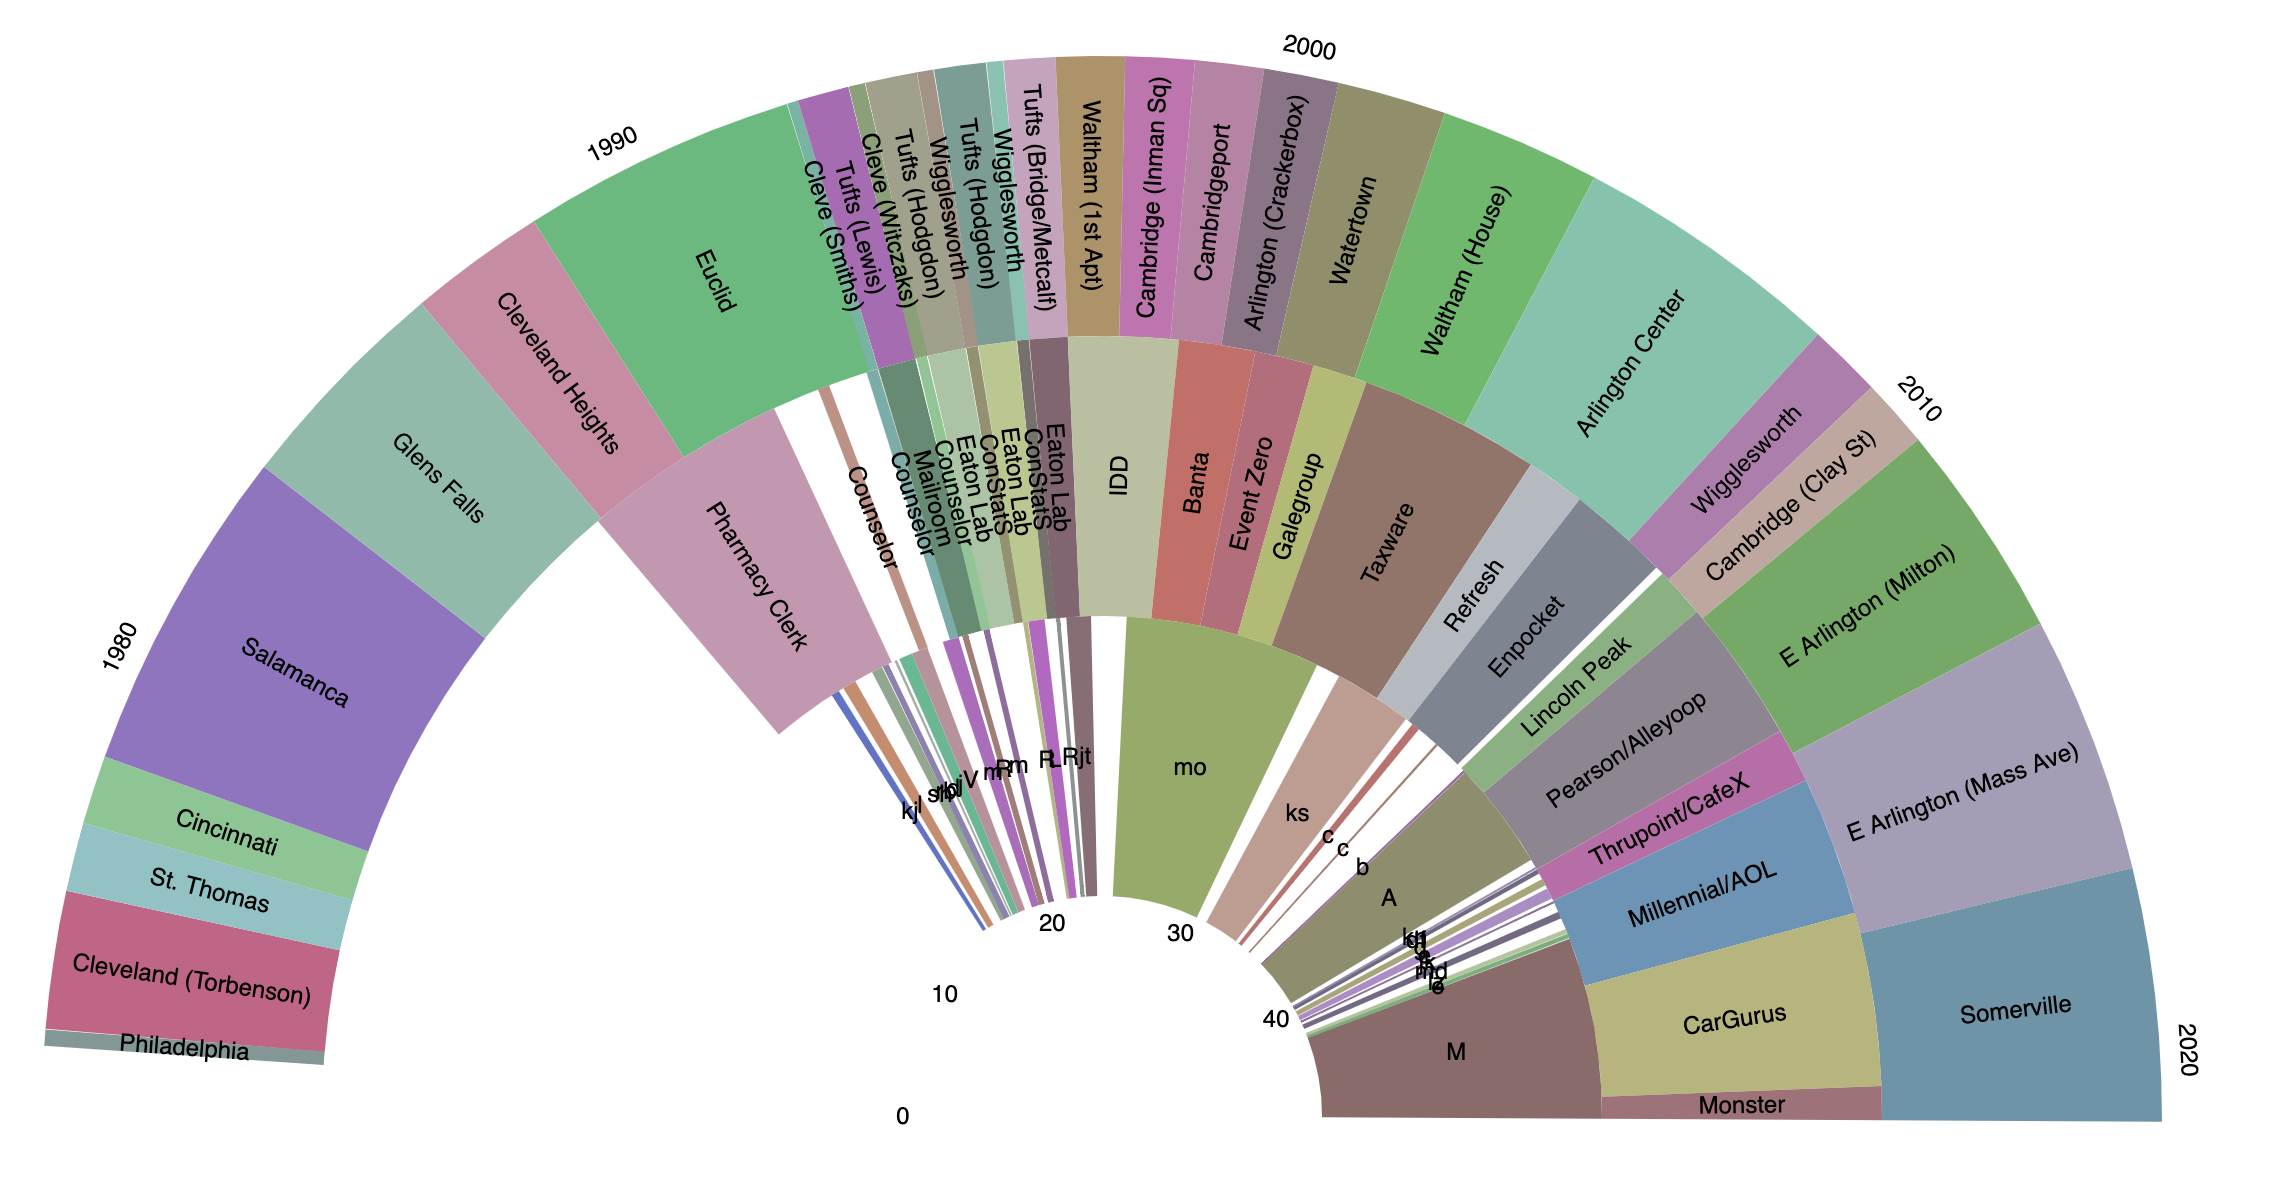
As usual with the experiments, I condensed things to where I've lived, jobs I've had, and people I've had some kind of romantic connection with.
Using a divided arch was interesting - it's more bounded than a simple linear timeline, and the curve gives a bit more room to cram stuff in, making better use of the plane.
Although Tufte famously warns against pie charts, I think this display does invite comparisons of ranges, without too much distortion.
(Also, I was thinking a bit about Jastrow illusion where two identical thick curved rails appear vastly different in size depending on how they're nested.)